Simple Extraction#
Open the app#
Start the application by entering in the terminal:
python -m datadigitizer
The main windows looks like in figure Main Window
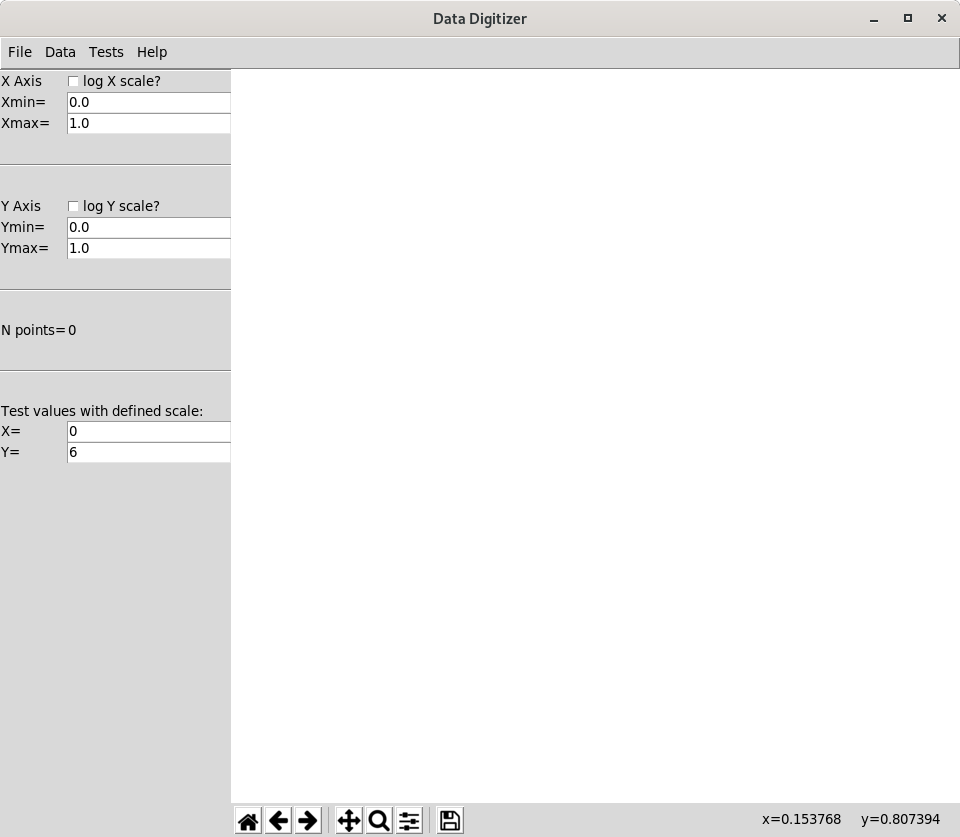
Main Window#
A quick overview of the different commands is shown in Help->How to use.
Load the image#
Load an image from which you want to extract data by pressing <Ctrl-o> or from File->Load Image.
Browse to the image and click OK.
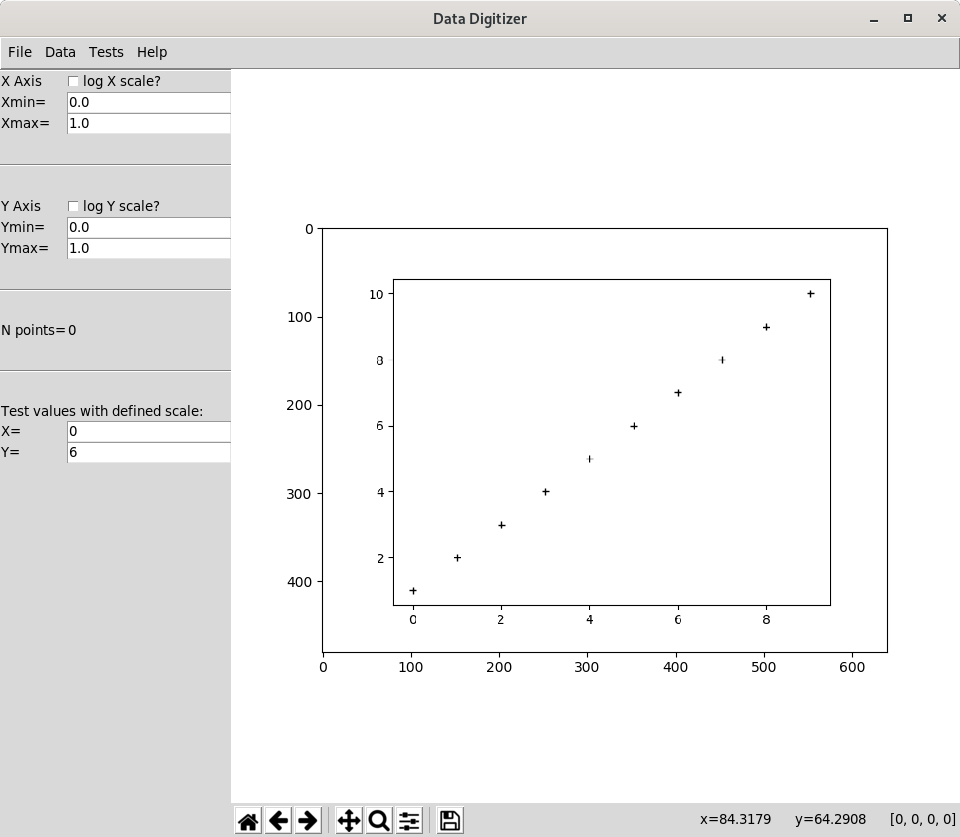
Load the image from which to extract data#
Position XY Limits#
Position 4 crosses for the axis limits in the order Xmin, Xmax, Ymin, Ymax
by pointing them with the mouse and adding them by pressing <Ctrl-a>.
You can hold down <a>, point with the mouse and left click for adding a red cross.
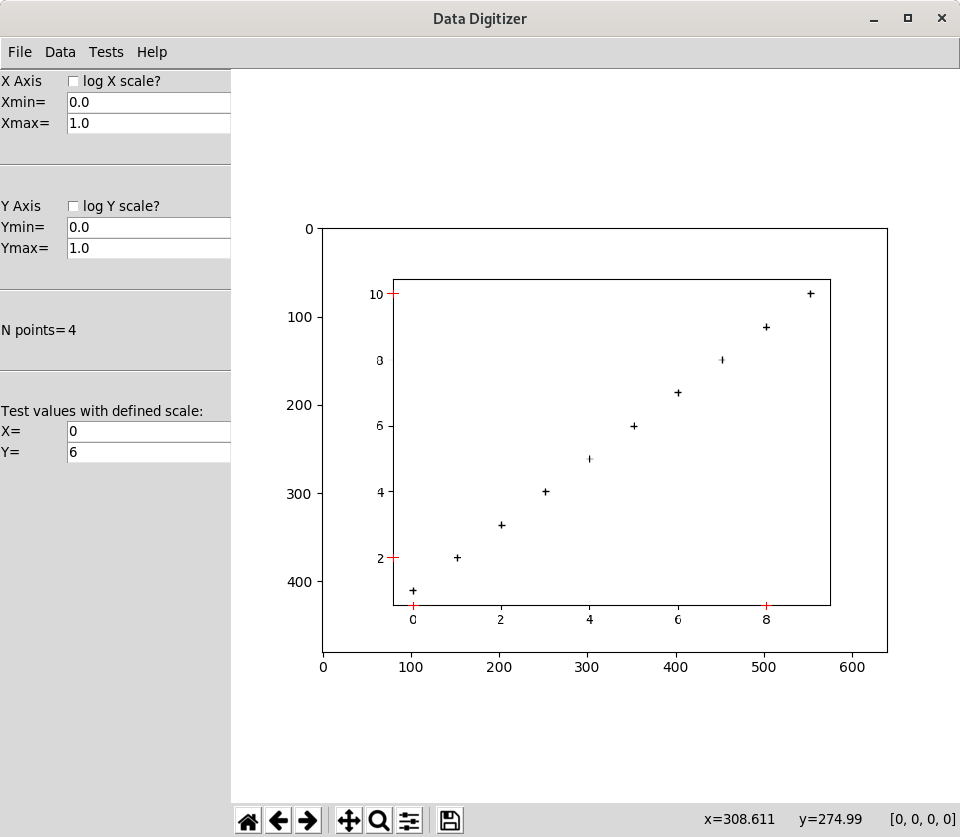
Position limits for x and y axes#
Set XY Limits#
Press in the order <Ctrl-k>, <Ctrl-j>, <Ctrl-h>, <Ctrl-g>.
It will set the Ymax, Ymin, Xmax and Xmin from the last (selected) data point, respectively.
When
<Ctrl-k>is pressed, the last of the 4 red crosses will become the Ymax value and will be colored in blue.When
<Ctrl-j>is pressed, the last of the 3 red crosses will become the Ymin value and will be colored in blue.When
<Ctrl-h>is pressed, the last of the 2 red crosses will become the Xmax value and will be colored in green.When
<Ctrl-k>is pressed, the last red cross will become the Xmin value and will be colored in green.
You can set the XY limits in the different order if needed and
you can also set all the limits at once from the last (selected) 4 data points (red crosses)
by pressing <Ctrl-l>.
It is also possible to select a limit with a left click and adjust it by pressing left, right, up and down.
The limits can be reverted to data by pressing <Ctrl-n>.
All shortcuts commands are also available through the menu Data.
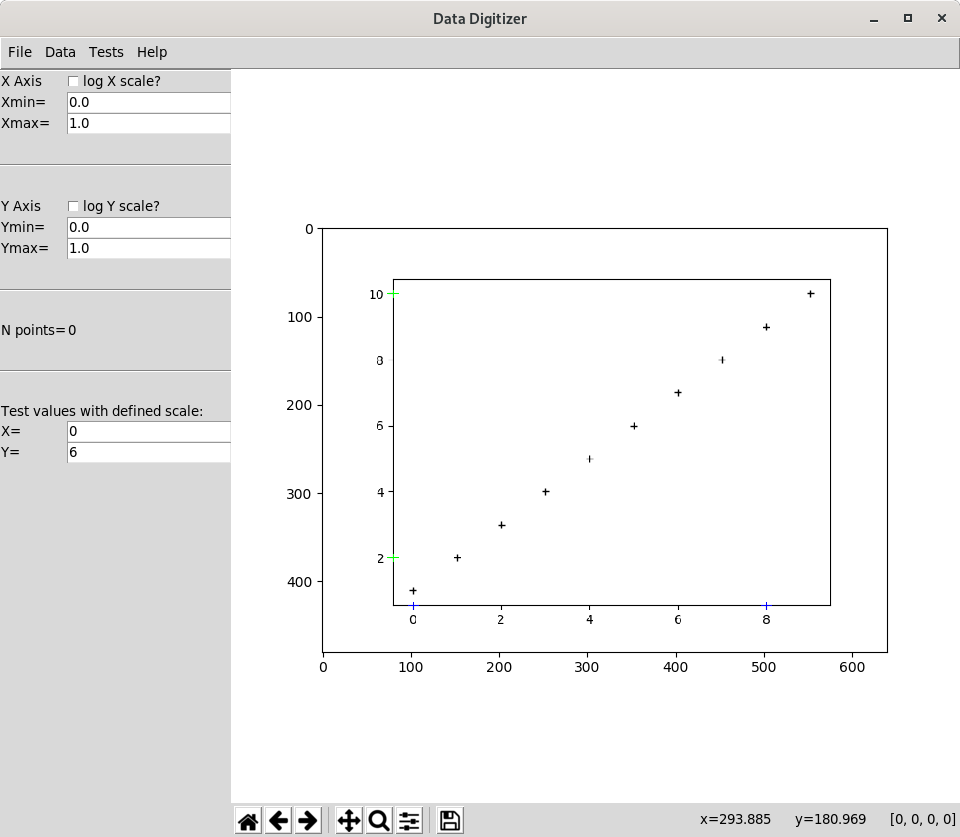
Set XY limits#
Enter XY Limits#
Enter the corresponding value for Xmax, Xmin, Ymin and Ymax and press <Enter>.
Switch to log scales if needed.
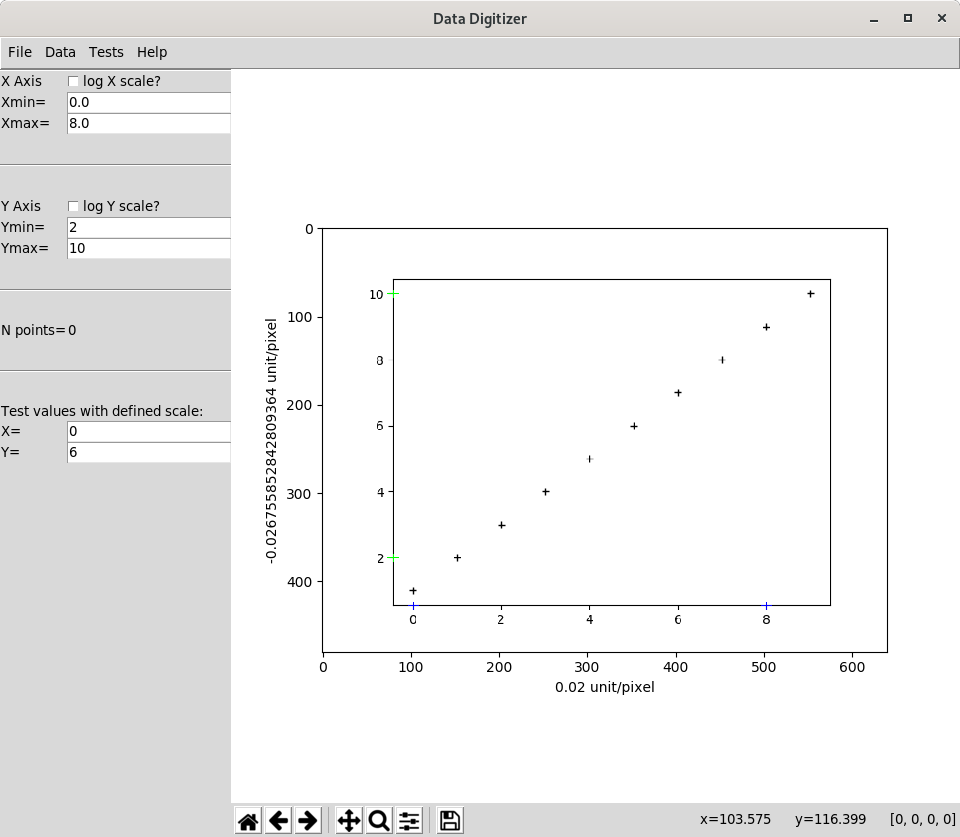
Enter XY values#
Add Data Points#
Add data points by pointing them with the mouse and adding them by pressing <Ctrl-a>.
You can hold down <a>, point with the mouse and left click for adding a red cross.
Once a data point is added you can adjust its position by pressing left, right, up and down arrows.
Press <Ctrl-m> or from the menu Data->Compute to compute the data with the definded XY scales.
Press <Ctrl-s> or from the menu File->Save Data to save data.
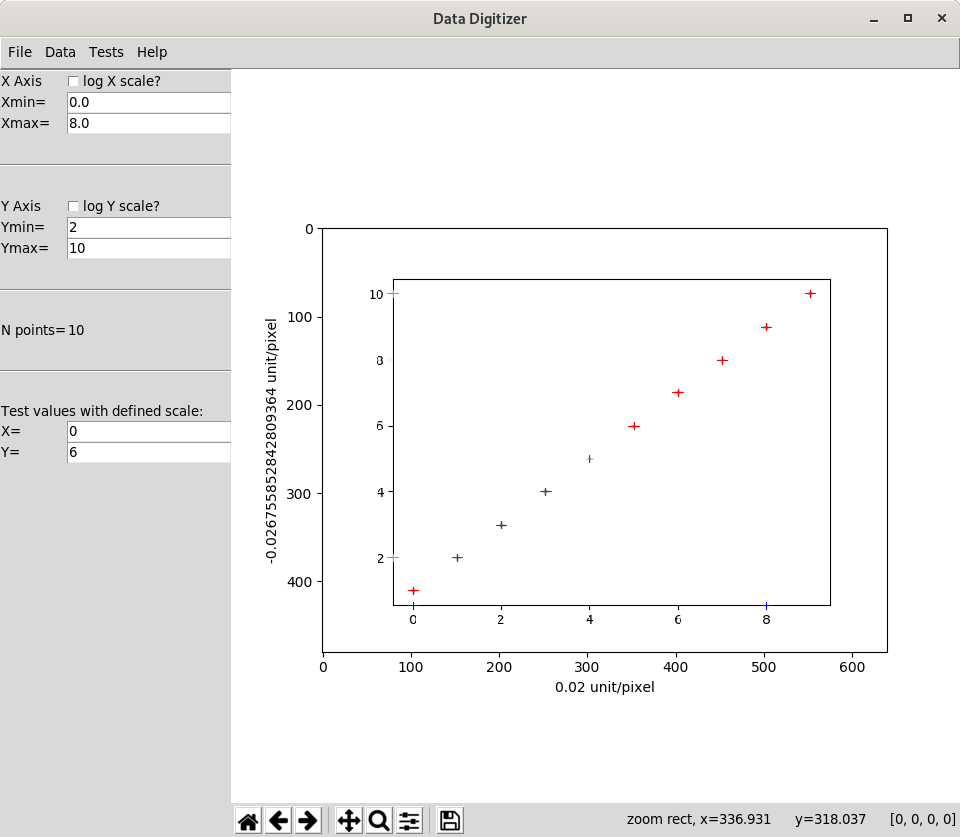
Set data values#
View Data Points#
The data values can be seen by pressing <Ctrl-t> or through the menu Data.
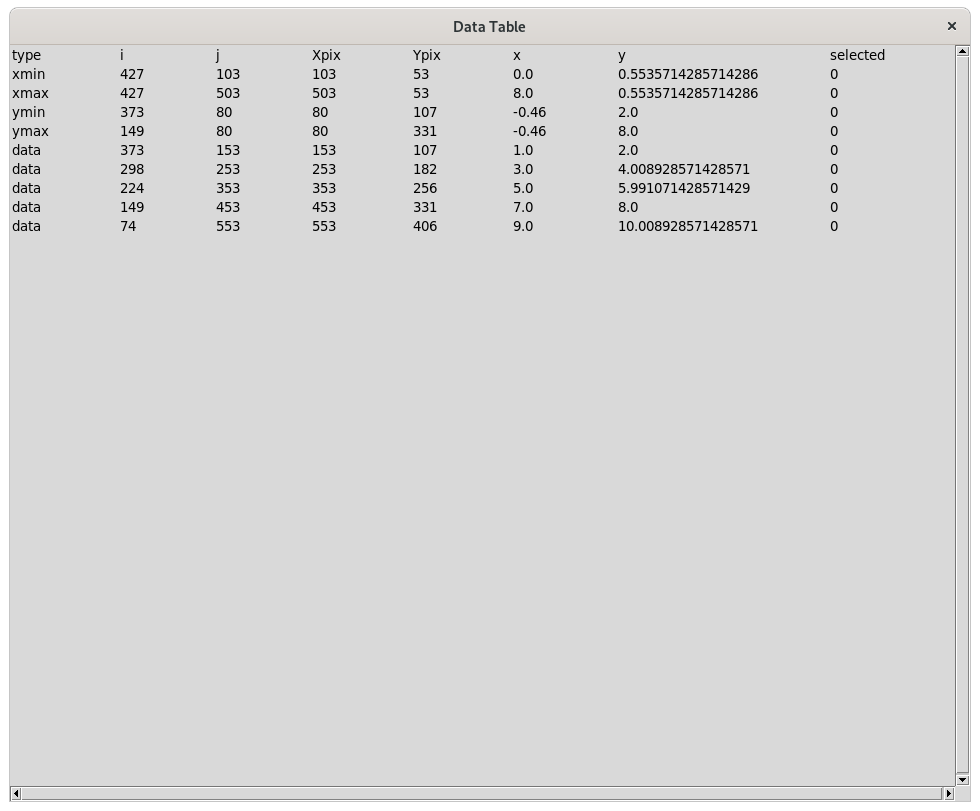
View data table#
Test Scale Values#
It is also possible de test the X/Y scales by entering values, e.g. X=0 and Y=6,
press <Enter> to ckeck if the scales are properly set.
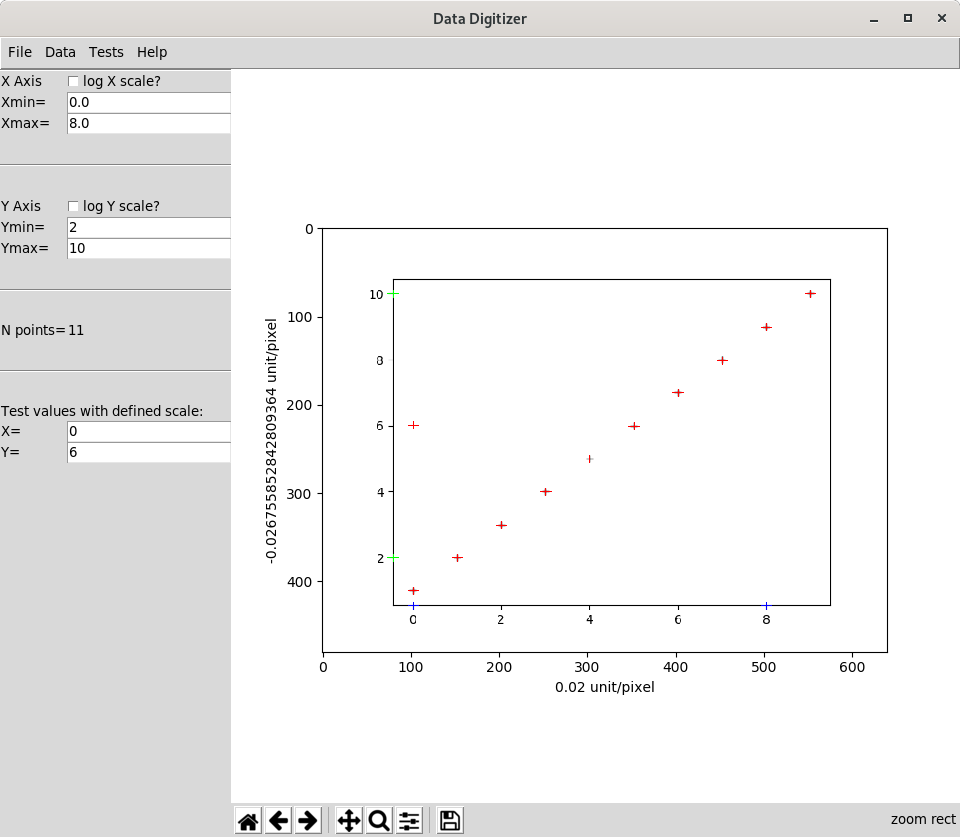
Test scale#